Data Interpretation For SBI PO : Set – 62
Want to Become a Bank, Central / State Govt Officer in 2020?
Join the Most awarded Coaching Institute & Get your Dream Job


Now Prepare for Bank, SSC Exams from Home. Join Online Coure @ lowest fee
Lifetime validity Bank Exam Coaching | Bank PO / Clerk Coaching | Bank SO Exam Coaching | All-in-One SSC Exam Coaching | RRB Railway Exam Coaching | TNPSC Exam Coaching | KPSC Exam Coaching
Data Interpretation For SBI PO : Set – 62
D.1-5) Read the following and answer the questions
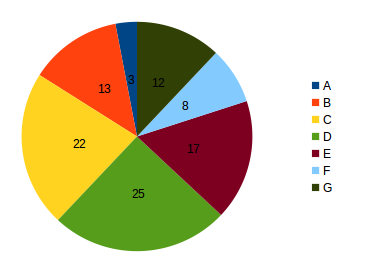
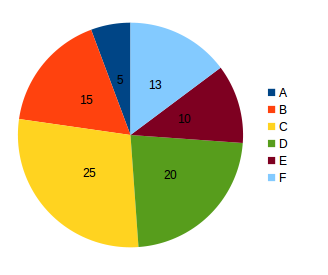
There are seven different types of tyres manufactured by a factory. The pie charts show the percentage of sales of the tyres in a city in two consecutive months of September and October. The total number of type B tyres sold in September and October were 1560 and 2250 respectively.
September

October

1) What is the maximum difference between the number of tyres of any two types sold taken together for September and that of other two types sold for October?
a) 3390
b) 5430
c) 4523
d) 4230
e) None of these
2) For how many types of tyres, there is an absolute decrease in the number sold in October over September?
a) 0
b) 1
c) 2
d) 3
e) None of these
3) The total sales of which of the following pairs of types of tyres in September was approximately equal to F type of tyres in October?
a) A & C
b) C & E
c) B & D
d) A & B
e) None of these
4) What is the difference in total sales between September and October in respect to only those types where there was an increase in sale?
a) 6520
b) 3540
c) 4530
d) Can’t be determined
e) None of these
5) The number of tyres of type D and E sold in September is approximately what percent of the number of tyres sold for these types in October?
a) 85%
b) 67%
c) 145%
d) 112%
e) None of these
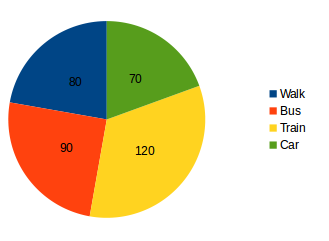
D.6-10) The pie-chart given below represents the number of students using different transport to a school in which total number of students is 2160.
Answer the questions based on the following diagram.
Values are given in angle

6. The number of students who come to school by car is
a) 70
b) 290
c) 420
d) 480
e) None of these
7. The ratio of the number of students who come to school by car to the number of students who come to school by bus is
a) 21: 24
b) 21: 27
c) 36: 27
d) 36: 21
e) None of these
8) The total number of students coming to school either by walking or by bus is
a) 480
b) 540
c) 1020
d) 170
e) None of these
9) The number of students who don’t come to School by train is
a) 720
b) 1020
c) 2040
d) 1440
e) None of these
10) The number of students coming to school by bus exceeds the number of students coming to school walking by
a) 10%
b) 12.5%
c) 11%
d) 11.5%
e) None of These
Read More : Click Here
Read More : Click Here


