Data Interpretation For SBI PO : Set – 33
Data Interpretation For SBI PO : Set – 33
D.1-5) Study the table carefully to answer the questions that follow.
Monthly Bill (in. Rs) of landline Phone, electricity, laundry and mobile phone paid by three different people in five different months
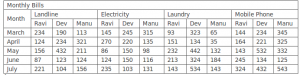
1) What is the respective ratio between the electricity bill paid by Manu in the month of April and the mobile phone bill paid by Ravi in the month of June?
a) 27: 49
b) 27: 65
c) 34: 49
d) 135: 184
e) 13: 24
2) In which months respectively did Manu pay the second highest mobile phone bill and the lowest electricity bill?
a) April and June
b) April and May
c) March and June
d) March and May
e) July and May
3) What is the difference between the mobile phone bill paid by Ravi in the month of May and the laundry bill paid by Dev in the month of March?
a) Rs. 180
b) Rs. 176
c) Rs. 190
d) Rs. 167
e) Rs. 196
4) What is the average electricity bill paid by Manu over all the five months together?
a) Rs. 183
b) Rs. 149
c) Rs. 159
d) Rs. 178
e) Rs. 164
5) What is the total amount of bill paid by Dev in the month of June for all the four commodities?
a) Rs. 608
b) Rs. 763
c) Rs. 731
d) Rs. 683
e) Rs. 674
D.6-10) Study the information carefully and answer the given questions:
Production of two types of items by four different companies in six different month
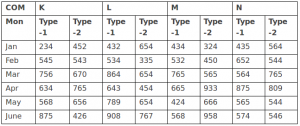
6) In which month was the difference between type-1 produced by com M and type-2 produced by com N second lowest ?
a) June
b) February
c) March
d) April
e) May
7) What was the average number of items of type -2 produced by all the companies together in the month of January?
a) 498.5
b) 489.5
c) 469.5
d) 496.5
e) none of these
8) What was the respective ratio between the no items of type-2 by M in may and no of items of type-1 by L in March?
a) 49/109
b) 31/38
c) 50/109
d) 43/58
e) None of these
9) Number of items of type -1 produced by com N in April was approximately what percentage of the no items oftype-2 by M in March?
a) 145
b) 150
c) 140
d) 160
e) 154
10) What is the approx percentage decrease in the Number of items of type -2 produced by company K in June as compared to previous month?
a) 30
b) 25
c) 22
d) 40
e) 35