Data Interpretation For SBI PO : Set – 60
Want to Become a Bank, Central / State Govt Officer in 2020?
Join the Most awarded Coaching Institute & Get your Dream Job


Now Prepare for Bank, SSC Exams from Home. Join Online Coure @ lowest fee
Lifetime validity Bank Exam Coaching | Bank PO / Clerk Coaching | Bank SO Exam Coaching | All-in-One SSC Exam Coaching | RRB Railway Exam Coaching | TNPSC Exam Coaching | KPSC Exam Coaching
Data Interpretation For SBI PO : Set – 60
D.1-5) Read the following and answer the questions:
Production of Fertilizers by a Company (in 1000 tonnes) Over the Years
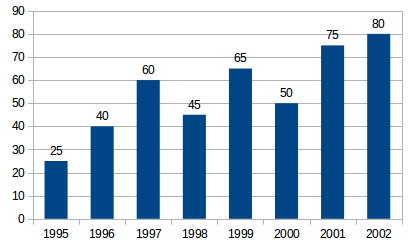
1) What was the percentage decline in the production of fertilizers from 1997 to 1998?
a) 33(1/3)%
b) 20%
c) 25%
d) 21%
e) None of these
2) The average production of 1996 and 1997 was exactly equal to the average production of which of the following pairs of years?
a) 2000 & 2001
b) 1999 & 2000
c) 1998 &2000
d) 1995 & 2001
e) None of these
3) What was the percentage increase in production of fertilizers in 2002 compared to that in 1995?
a) 320%
b) 300%
c) 220%
d) 200%
e) None of these
4) In which year was the percentage increase in production as compared to the previous year the maximum?
a) 2002
b) 2001
c) 1997
d) 1996
e) None of these
5) In how many of the given years was the production of fertilizers more than the average production of the given years?
a) 1
b) 2
c) 3
d) 4
e) None of these
D.6-10) Study the following line graph which gives the number of students who joined and left the school in the beginning of year for six years, from 1996 to 2001.
Initial Strength of school in 1995 = 3000.
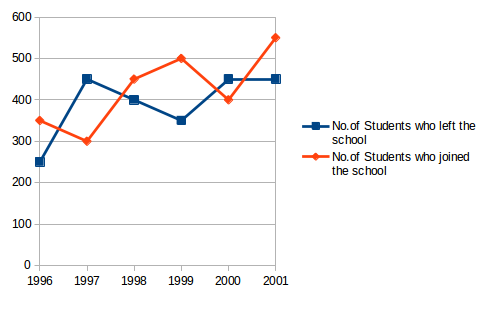
6) The number of students studying in the school during 1999 was?
a) 2950
b) 3000
c) 3100
d) 3150
e) None of these
7) For which year, the percentage rise/fall in the number of students who left the school compared to the previous year is maximum?
a) 1997
b) 1998
c) 1999
d) 2000
e) None of these
8) The strength of school incresed/decreased from 1997 to 1998 by approximately what percent?
a) 1.2%
b) 1.7%
c) 2.1%
d) 2.4%
e) None of these
9) The number of students studying in the school in 1998 was what percent of the number of students studying in the school in 2001? a) 92.13% b) 93.75% c) 96.88% d) 97.25% e) None of these 10) The ratio of the least number of students who joined the school to the maximum number of students who left the school in any of the years during the given period is? a) 7:9 b) 4:5 c) 3:4 d) 2:3 e) None of these
Read Data Interpretation Set – 59 : CLICK HERE
Read Data Interpretation Set – 58 : CLICK HERE