Important Data Interpretation Set – 99
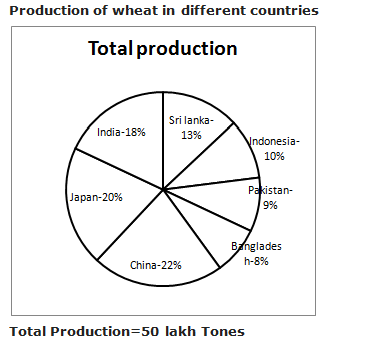
D.1-5) Study the following graph carefully to answer the questions:
Production of wheat in different countries

Total Production=50 lakh Tonnes
Production: Scientific Vs Conventional Methods in Percentage

Q.1) What is the difference between the production by scientific method and conventional method in Indonesia?
a) 2.3 lakh tonnes
b) 2.8 lakh tones
c) 2.5 lakh tonnes
d) 3 lakh tones
e) None of these
Click Here to View Answer
a) 2.3 lakh tonnes
Production In Indonesia= 50 x 10/100= 5 lakh tones
Difference= 5 x ((73 – 27))/100= 2.3 lakh tones
Q.2) What is the average production of wheat by scientific method for all the countries?
a) 3.1 lakh tonnes
b) 4.24 lakh tones
c) 2.6 lakh tonnes
d) 3.07 lakh tones
e) None of these
Click Here to View Answer
b) 4.24 lakh tones
Production of wheat by scientific method in
India= 50 x (18/100)x (32/100)= 2.88 lakh tones
Japan = 50 x (20/100)x (78/100)= 7.8 lakh tones
China= 50 x (22/100)x (70/100)= 7.7 lakh tones
Bangladesh= 50 x (8/100)x (20/100)= 0.8 lakh tones
Pakistan= 50 x (9/100)x (66/100)= 2.97 lakh tones
Indonesia= 50 x (10/100)x (73/100)= 3,65 lakh tones
Sri Lanka= 50 x (13/100)x (60/100)= 3.9 lakh tones
So Average = (2.88 + 7.8 + 7.7 + 0.8 + 2.97 + 3.65 + 3.9)/7= 4.24 lakh tones
Q.3) What is the ratio of production by conventional method in Pakistan to that by scientific method in Japan?
a) 9/40
b) 99/260
c) 51/260
d) 48/77
e) None of these
Click Here to View Answer
c) 51/260
Production by conventional method in Pakistan = 50 x (9/100)x (34/100)= 1.53 lakh tones
Production by scientific method in Japan= 7.8 lakh tones
Required ratio= 1.53 : 7.8 = 51 : 260
Q.4) The production of wheat in Sri Lanka by Conventional method is approximately how many times the production in India by scientific method?
a) 1.2
b) 1.5
c) 0.9
d) 2.1
e) None of these
Click Here to View Answer
c) 0.9
Production of wheat in Sri Lanka by Conventional method= 50 x (13/100)x (40/100)= 2.6 lakh tones
Production in India by scientific method= 50 x (18/100)x (32/100)= 2.88 lakh tones
According to question, 2.88 X x = 2.6
x = 2.6/2.88= 0.9 times
Q.5) The production of wheat in India by Scientific method is approximately how many times the production in Pakistan by Conventional method?
a) 2.88
b) 2.07
c) 2.61
d) 0.81
e) None of these
Click Here to View Answer
e) None of these
Production of wheat in India by Scientific method= 50 x (18/100)x (32/100)= 2.88 lakh tones
Production of wheat in Pakistan by Conventional method=50×9/100×34/100=1.53
Required answer,
=2.88/1.53=1.88
D.6-10) Study the following graph carefully to answer the questions:
Data of different states regarding population of states in the year 1991

Table shows the ratio of male to female graduates in different states and percentage of people non graduates
|
States
|
Ratio of Male to female graduates
|
Percentage of non-graduates
|
|
Male
|
Female
|
|
Kerala
|
3
|
2
|
20%
|
|
Gujarat
|
1
|
3
|
35%
|
|
Orissa
|
3
|
5
|
25%
|
|
Goa
|
2
|
3
|
15%
|
|
Bihar
|
3
|
1
|
20%
|
|
Uttarkhand
|
5
|
1
|
30%
|
|
Punjab
|
7
|
5
|
25%
|
Q.6) In which state has highest number of female graduates in all the states together?
a) Punjab
b) Gujarat
c) Goa
d) Kerala
e) Bihar
Click Here to View Answer
b) Gujarat
Kerala=9/100×8 lakh=72000
Gujarat=25/100×8 lakh=200000
Orissa=20/100×8lakh=160000
Goa=12/100×8lakh=96000
Bihar=11/100×8lakh=88000
Uttarkhand=15/100×8lakh=120000
Punjab=8/100×8lakh=64000
Graduates in all the states
Kerala=80/100×72000=57600
Gujarat=65/100×200000=130000
Orissa=75/100×160000=120000
Goa=85/100×96000=81600
Bihar=80/100×88000=70400
Uttarkhand=70/100×120000=84000
Punjab=75/100×64000=48000
Number of female graduates in all the states
Kerala=57600×2/5=23040
Gujarat=130000×3/4=97500
Orissa=120000×5/8=75000
Goa=81600×3/5=48960
Bihar=70400×1/4=17600
Uttarkhand=84000×1/6=14000
Punjab=48000×5/12=20000
In the state Gujarat has maximum female graduates.
Q.7) What is the difference between the number of female graduates in Bihar, Orissa and Punjab together and the number of male graduates in the state Uttarkhand, Goa and Gujarat together?
a) 28000
b) 27605
c) 26080
d) 22540
e) None of these
Click Here to View Answer
d) 22540
Number of graduates,
Bihar=80/100×88000=70400
Punjab=75/100×64000=48000
Orissa=75/100×160000=120000
Gujarat=65/100×200000=130000
Goa=85/100×96000=81600
Uttarkhand=70/100×120000=84000
Number of female graduates,
Orissa=120000×5/8=75000
Bihar=70400×1/4=17600
Punjab=48000×5/12=20000
Number of male graduates,
Uttarkhand=84000×5/6=70000
Goa=81600×2/5=32640
Gujarat=130000×1/4=32500
Required difference=(75000+17600+20000)-(70000+32640+32500)
=135140-112600=22540
Q.8) If the total population of all the states 20% increased in the year 1992 compared to the previous year and all other data are same in the year 1991, approximately What percentage of graduate male in Bihar is the graduates female in Orissa?
a) 75%
b) 80%
c) 70%
d) 72%
e) None of these
Click Here to View Answer
c) 70%
Total population in the year 1992= 120/100×8lakh=9.6 lakh
Population in Bihar=11/100×9.6=105600
Population in Orissa=20/100×9.6=192000
Male gradutes in Bihar=105600×80/100×3/4=63360
Female graduates in Orissa=192000×75/100×5/8=90000
Reqired percentage=63360/90000×100=70%
Q.9) If the ratio of non-graduates male to female is 1:3 in Bihar, Punjab, Kerala and Gujarat, the number of male non graduates in Bihar and Punjab together is approximately what percentage more/less the number of non-female graduates in Kerala and Gujarat together?
a) 87%
b) 96%
c) 88%
d) 84%
e) None of these
Click Here to View Answer
a) 87%
Total population in given states,
Kerala=9/100×8 lakh=72000
Gujarat=25/100×8 lakh=200000
Bihar=11/100×8lakh=88000
Punjab=8/100×8lakh=64000
Number of male non graduates,
Bihar=88000×20/100×1/4=4400
Punjab=64000×25/100×1/4=4000
Number of female non-graduates,
Kerala=72000×20/100×3/4=10800
Gujarat=200000×35/100×3/4=52500
Required percentage=((52500+10800)-(4400+4000))/63300×100=86.7% ~ 87%
Q.10) What is the difference between the number of male graduates in all the states together and the number of female graduates in all the states together?
a) 650
b) 600
c) 700
d) 680
e) None of these
Click Here to View Answer
Kerala=9/100×8 lakh=72000
Gujarat=25/100×8 lakh=200000
Orissa=20/100×8lakh=160000
Goa=12/100×8lakh=96000
Bihar=11/100×8lakh=88000
Uttarkhand=15/100×8lakh=120000
Punjab=8/100×8lakh=64000
Graduates in all the states
Kerala=80/100×72000=57600
Gujarat=65/100×200000=130000
Orissa=75/100×160000=120000
Goa=85/100×96000=81600
Bihar=80/100×88000=70400
Uttarkhand=70/100×120000=84000
Punjab=75/100×64000=48000
Number of female graduates in all the states
Kerala=57600×2/5=23040
Gujarat=130000×3/4=97500
Orissa=120000×5/8=75000
Goa=81600×3/5=48960
Bihar=70400×1/4=17600
Uttarkhand=84000×1/6=14000
Punjab=48000×5/12=20000
Number of male graduates,
Kerala=57600×3/5=34560
Gujarat=130000×1/4=32500
Orissa=120000×3/8=45000
Goa=81600×2/5=32640
Bihar=70400×3/4=52800
Uttarkhand=84000×5/6=70000
Punjab=48000×7/12=28000
Required difference
=(34560+32500+45000+32640+52800+70000+28000)-(20000+14000+17600+48960+23040+97500+75000)
=295500-296100=600


3 comments
Data interpretation SET 99
1.In the pie chart and line graph is not clearly mention the countries
2.In the DI second question also not mention states
so please upload the data …
data corrected
In both the above Di pi chart value( countries name) is not mentioned