
Data Interpretation For SBI PO : Set – 28

Data Interpretation For SBI PO : Set – 47
D.1-5) Study the given bar-chart carefully and answer the following questions.
The graph shows the number of villages in four different states where electrification was done in different years.
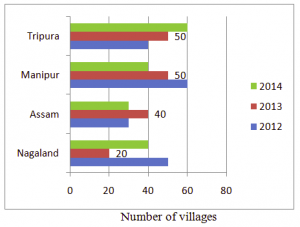
1) The number of villages in Nagaland where electrification was done in 2013 is what percentage of the number of villages in Tripura where electrification was done in 2014?
a) 55.5%
b) 44.4%
c) 77.7%
d) 66.6%
e) 33.3%
2) What is the ratio of the villages in Assam to those in Manipur where electrification was done in 2013?
a) 1 : 4
b) 3 : 4
c) 1 : 2
d) 4 : 5
e) 3 : 2
3) In which state was the electrification work done in maximum villages during the given three years?
a) Assam
b) Manipur
c) Manipur and Tripura
d) Nagaland
e) Manipur and Assam
4) If the cost of electrification of a village is Rs.75 lakh then what is the cost of electrification in four states during the given period?
a) Rs.4319000000
b) Rs.3825000000
c) Rs.4143000000
d) Rs.355700000
e) Rs.2721000000
5) In which year was the electrification work done in maximum number of villages?
a) 2012
b) 2013
c) 2014
d) 2013 and 2012
e) 2012 and 2014
D.6-10) Study the following graph carefully to answer the given questions.
Number of people using electronic devices from various cities
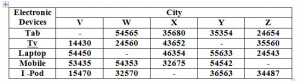
6) If the no of people used Tab in the city V is 75% of the people using mobile in the city Y .Find the average no of people using Tab in all the cities together ?
a) 38232
b) 43213
c) 34576
d) 31787
e) None of these
7) What is the ratio between the no of people using Tv and and I – pod in the city X ,no of people using I – pod in the city X is 2/5 th of the no of people using tab in the city W ?
a) 36:25
b) 12:8
c) 2:1
d) 7:3
e) None of these
8) What is the difference between the total no of people using all electronic devices in the city W and city Z ?(No of people using laptop in the city W and no of people using mobile in the city Z are equal to no of people using TV in the city X)
a) 32550
b) 40834
c) 46804
d) 28656
e) None of these
9) No of people using I-pod is what % of the people using mobile in the city V,W and Z together ?
a) 54.5%
b) 65.8%
c) 34.7%
d) 73.7%
e) None of these
10) Which city has the highest no of people using Mobile ?
a) V
b) W
c) X
d) Y
e) Z