Data Interpretation For SBI PO : Set – 34
Data Interpretation For SBI PO : Set – 34
D.1-5) The following table gives the sales of batteries manufactured by a company over the years. Number of Different Types of Batteries Sold by a Company Over the Years (Numbers in Thousands)

1) What was the approximate percentage increase in the sales of 55AH batteries in 1998 compared to that in 1992?
a) 28%
b) 31%
c) 33%
d) 34%
e) none
2) The total sales of all the seven years is the maximum for which battery?
a) 4AH
b) 7AH
c) 32AH
d) 35AH
e) None
3) What is the difference in the number of 35AH batteries sold in 1993 and 1997?
a) 24000
b) 28000
c) 35000
d) 39000
e) none
4) The percentage of 4AH batteries sold to the total number of batteries sold was maximum in the year?
a) 1994
b) 1995
c) 1996
d) 1997
e) none
5) In case of which battery there was a continuous decrease in sales from 1992 to 1997 ?
a) 4AH
b) 7AH
c) 32AH
d) 35AH
e) None
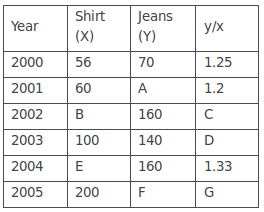
D.6-10) Study the following table carefully and answer the questions that follow. A few data are assigned alphabetically:
(Sales of shirts and jeans sold by Co. X in various years, Rs. Crores)
6) The per cent increase in the shirts sale between years2002 and 2004 is:
a) 40%
b) 50%
c) 45%
d) 60%
e) Can’t say
7) The per cent increase in the jeans sale between 2001 and 2005 is:
a) 75%
b) 37.5%
c) 375%
d) 750%
e) Can’t be determined
8) If G = 1.5, what per cent is sales of jeans in 2005 of sales of jeans in 2002?
a) 150
b) 175
c) 187.5
d) 160
e) 190.5
9) If C : D = 1 : 2 then 7B = ?
a) 1500
b) 1600
c) 1800
d) 1230
e) 1430
10) The Value of A:E is
a) 0.1
b) 0.6
c) 0.8
d) Cannot be determined
e) None of these