Important Aptitude Questions for IBPS SO Prelims & IBPS Clerk Mains Exam
Important Aptitude Questions for IBPS SO Prelims & IBPS Clerk Mains Exam
Dear Banking Aspirant,
Aptitude section is one of the scoring part in the recently over IBPS CLERK Prelims Exam 2017 and also the IBPS CLERK MAINS Examination 2017. So this could be a major breakthrough for your scores in the exams, so concentrating more on this topic will lead you to score more in this particular section where the time is needed when compared to the other sections.
We are providing daily questions based on various topics from the Aptitude section and you can practice the same to score more in the forthcoming exams.
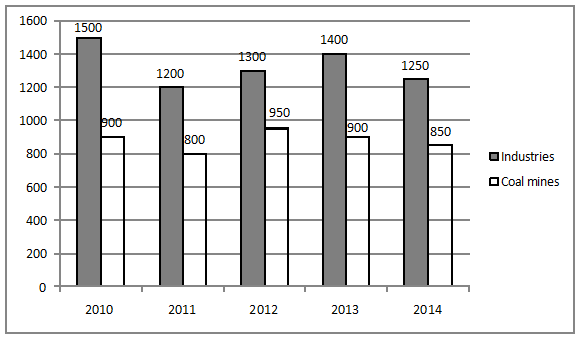
D.1-5) Study the following information and answer the following questions.
Following bar graph shows number of child labourers in industries and coal mines for the given years.

Q.1) Find average number of child labourers in industries for the given period?
a) 1410
b) 1380
c) 1330
d) 1320
e) 1390
Q.2) Total number of child labourers in both categories in the year 2012 is approximately what percentage of total number of child labourers in industries in the year 2010 and 2011 together?
a) 88.89%
b) 83.33%
c) 85.33%
d) 84.44%
e) None of these
Q.3) What is the ratio of number of child labourers in industries in the year 2011 and 2012 together to the number of child labourers in coal mines in the year 2013 and 2014 together?
a) 10:7
b) 9:7
c) 11:8
d) 13:9
e) 11:7
Q.4) If in 2015 number of child labourers in industries is 20% more than that of the average of the child labourers for previous two years and number of child labourers in coal mines is 20% less than that of the average of child labourers for previous two years, find the total number of child labourers in 2015.
a) 2180
b) 2290
c) 2250
d) 2950
e) None of these
Q.5) Number of child labourers in coal mines in 2012 and 2013 together is approximately what percentage more or less than the number of child labourers in coal mines in 2010 and 2011 together?
a) 7%
b) 9%
c) 10%
d) 5%
e) 6%
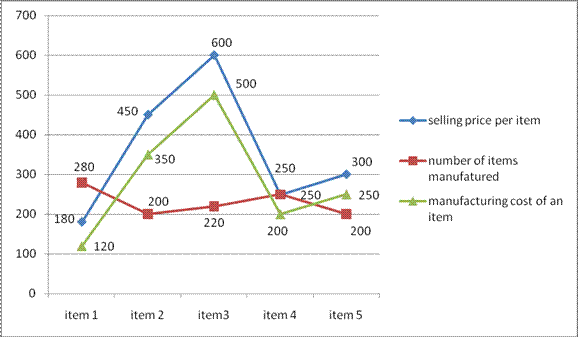
D.6-10) Study the following information and answer the following questions.
Below line graph shows the selling price, manufacturing cost and number of items manufactured for different items in a Company.

Q.6) For which item total profit in maximum?
a) Item 1
b) Item 2
c) Item 3
d) Item 4
e) Item 5
Q.7) If 50% of item 4 is sold at selling price and remaining item is sold at 20% less than the selling price, then what is the total profit in selling item 4?
a) Rs.6350
b) Rs.5670
c) Rs.6550
d) Rs.6250
e) None of these
Q.8) What is the ratio of total manufacturing cost of item 1 to total selling price of item 3?
a) 12:49
b) 14:55
c) 13:37
d) 14:37
e) None of these
Q.9) The total profit of item 3 and item 4 together is approximately what percentage of total manufacturing cost of the those items?
a) 28.34%
b) 23.54%
c) 21.56%
d) 22.35%
e) None of these
Q.10) What is the average number of five items manufactured?
a) 250
b) 220
c) 210
d) 205
e) 225
Answers
1 c
2 d
3 a
4 b
5 b
6 c
7 d
8 b
9 c
10 b
Explanation
Q.1) c
![]()
Q.2) d
![]()
Q.3) a
![]()
Q.4) b
![]()
![]()
![]()
Q.5) b
![]()
![]()
![]()
Q.6) c
![]()
![]()
![]()
![]()
![]()
For item 3 total profit is maximum.
Q.7) d
![]()
![]()
Q.8) b
![]()
Q.9) c
![]()
![]()
Q.10) b
![]()


