Important Data Interpretation For SBI PO : Set -70
Want to Become a Bank, Central / State Govt Officer in 2020?
Join the Most awarded Coaching Institute & Get your Dream Job


Now Prepare for Bank, SSC Exams from Home. Join Online Coure @ lowest fee
Lifetime validity Bank Exam Coaching | Bank PO / Clerk Coaching | Bank SO Exam Coaching | All-in-One SSC Exam Coaching | RRB Railway Exam Coaching | TNPSC Exam Coaching | KPSC Exam Coaching
Important Data Interpretation For SBI PO : Set -70
D.1-5) The following line and bar graphs show the number of POS centres in urban, semi-urban and rural areas of different states in the year 2017. Refer to the graphs to answer the questions that follow.
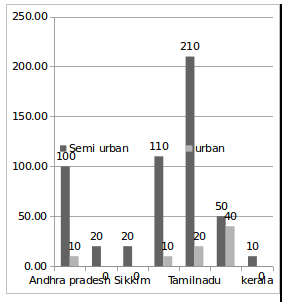

1) If the POS centres have increased at a steady rate of 25% in all states of India, then what will be the number of POS centres in Andhra Pradesh in the year 2018?
a) 1050
b) 950
c) 850
d) 750
e) 650
2) If Kerala Government decided to increase POS centres in rural areas at 25% per year and in semi-urban areas at 20% per year, then what will be the total number of POS centres in Kerala in 2018?
a) 80
b) 50
c) 87
d) 82
e) 31
3) If in 2017 the average number of POS centres in rural areas of Andhra Pradesh, Telegana, Sikkim, Mizoram, Tamilnadu, Bihar, Kerala and Gujarat is 670, then the number of POS centres in rural areas of Gujarat will be:
a) 790
b) 400
c) 820
d) 500
e) 630
4) In the year 2019, the Government decided to increase the POS centres according to the population increase in that particular state. If the semi-urban population of Mizoram has increased by 30% from 2017, then what will be the number of POS centres that the Government has to increase in the year 2019 in semi-urban parts of Mizoram?
a) 122
b) 143
c) 150
d) 138
e) 141
5) In which of the following states the ratio of rural POS centres to remaining POS centres the second lowest?
a) Bihar
b) Mizoram
c) Andhra pradesh
d) Telegana
e) Kerala
D.6-10) Following bar graph shows the production of a grains (In thousands) by two Agriculture land A and B over the years. The line graph shows the percentage sale of these Agriculture products in given years
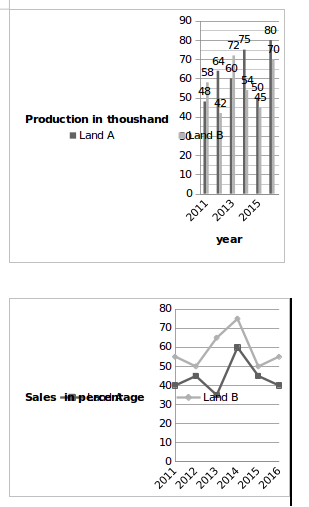
6) what is the difference between average grains produced by land A and land B in the whole period of six years?
a) 2
b) 3
c) 6
d) 5
e) 4
7) What is the average (approx) sale from land B together in the whole six years?
a) 33533
b) 35333
c) 36533
d) 32333
e) 34533
8) In the following years which year the percentage rise/fall in production of Land B is maximum?
a) 2012
b) 2013
c) 2014
d) 2015
e) 2016
9) Sale of grains from Land B in year 2012 is approximately what percentage of sale of grain land A in year 2015?
a) 64%
b) 72%
c) 78%
d) 93%
e) 96%
10) Sale of grains from Land A in year 2016 is approximately how much percentage more or less than the sale of grains from Land B in that year?
a) 24%
b) 20%
c) 25%
d) 26%
e) 31%