Practice Questions – Data Interpretation -2
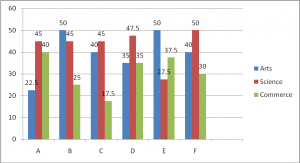
Direction (1-4): Study the following graph carefully and answer the questions given below
Total number of Arts, Science and Commerce Students in Various colleges

1. The number of students taking Arts in college B, is how thousand fewer than the number of students taking Arts in college A and college C together?
(a) 12.5
(b) 27.5
(c) 50
(d) 10
(e) 62.5
2. In college F, the students taking commerce is what percent of the total number of students taking Arts, science and commerce in all?
(a) 45
(b) 55
(c) 59
(d) 70
(e) 25
3. How many candidates (in thousands) have taken commerce from all the colleges?
(a) 165
(b) 177
(c) 185
(d) 193
(e) 199
4. What is the respective ratio of the number of the students taking science to the number of students taking Arts in college D?
(a) 14:19
(b) 12: 17
(c) 17: 19
(d) 19:14
(e) 13:18
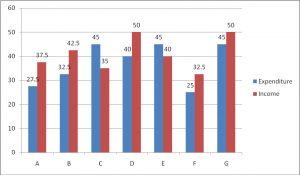
Directions (5-8): Study the following graph carefully and answer the questions given below it
Account of income and expenditure (in crores) of seven companies in the years 2000
Percentage Profit/loss=
![]()

5. Approximately, what is the percentage of profit/loss that companies C and D had together?
(a) 10% profit
(b) 12% profit
(c) 10% loss
(d) 12% loss
(e) There was no loss or profit
6. If the income of company A had increased by 10% in year 2000 from year 1999 and profit earned in 1999 was 20% what was its expenditure in 1999?
(the value upto two decimal places in crores)
(a) 36.36
(b) 32.32
(c) 30.30
(d) Can’t be determined
(e) None of these
7. If the expenditure of Company G in 2000 was 20% more than its expenditure in the year 1999 and the Company has earned a profit of 10% in 1999. What was the company income in 1999 in crores Rs.?
(a) 37.5
(b) 41.25
(c) 34.09
(d) Can’t be determined
(e) None of these
8. Which of the following Companies had the highest percentage of profit/loss in 2000?
(a) B
(b) C
(c) F
(d) A
(e) None of these


