Data Interpretation for SBI PO : Set 06
Data Interpretation for SBI PO : Set 06
Directions: 1-5) Data related to number of candidates appeared and qualified in a competitive exam from 2 states during 5 years.
| Year | Andhra Pradesh | Uttar Pradesh | ||
| Number of Appeared candidates | Percentage of Appeared candidates who qualified | Number of Appeared candidates | Percentage of Appeared candidates who qualified | |
| 2012 | 450 | 60% | ___ | 30% |
| 2013 | 600 | 43% | ___ | 45% |
| 2014 | ___ | 60% | 280 | 60% |
| 2015 | 480 | 70% | 550 | 50% |
| 2016 | 380 | ___ | 400 | ___ |
Note: Few values are missing in the table (indicated by __).
A candidate is expected to calculate the missing value, if it is required to answer the given questions on the basis of given data and information.
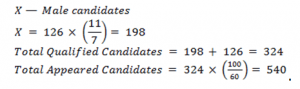
1) Out of the number of qualified candidates from State Andhra Pradesh in 2014, the respective ratio of male and female candidates is 11:7. If the number of female qualified candidates from State Andhra Pradesh in 2014 is 126, what is the number of appeared candidates(both male and female) from State Andhra Pradesh in 2014?
A. 630
B. 510
C. 570
D. 650
E. 540
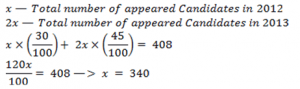
2) Number of Appeared Candidates from State Uttar Pradesh increased by 100% from 2012 to 2013. If the total number of qualified candidates from State uttar Pradesh in 2012 and 2013 together is 408, what is the number of appeared candidates from State Uttar Pradesh in 2012?
A. 380
B. 320
C. 340
D. 360
E. 300
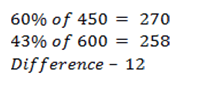
3) What is the difference between number of qualified candidates from State Andhra Pradesh in 2012 and that in 2013?
A. 12
B. 14
C. 16
D. 18
E. 20
4) If the average number of qualified candidates from State Uttar Pradesh in 2014, 2015 and 2016 is 210, what is the number of qualified candidates from state Uttar Pradesh in 2016?
A. 191
B. 195
C. 183
D. 187
E. 179
![]()
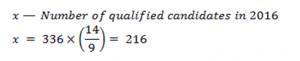
5) If the respective ratio between number of qualified candidates from State Andhra Pradesh in 2015 and 2016 is 14:9, what is the number of qualified candidates from State Andhra Pradesh in 2016?
A. 252
B. 207
C. 216
D. 234
E. 198
Directions 6-10): Following Bar chart depicts the performance of Company A over the years. Answer the questions that follow data is given in lakhs.
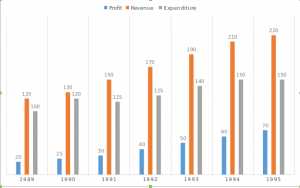
6) The average revenue collected in the given 7 years is approximately
a) Rs. 164 lakh
b) 167 lakh
c) 170 lakh
d) 175 lakh
e) 180 lakh
![]()
7) The expenditure for the 7 years together form approximately what percent of the revenues during the same period?
a) 76%
b) 67%
c) 62%
d) 83%
e) 85%
![]()
8) Which year showed the greatest percentage increase in profit as compared to the previous year?
a) 1993
b) 1994
c) 1990
d) 1992
e) None of these
![]()
9) In which year was the percentage ofgrowth in expenditure maximum as compared to the previous year?
a) 1993
b) 1995
c) 1991
d) 1990
e) None of these
10) The average profit collected in the given 7 years is approximately
a) Rs. 44 lakh
b) Rs. 42 lakh
c) 46 lakh
d) 48 lakh
e) 40 lakh
![]()