Important MIXED DATA INTERPRETATION Questions for IBPS CLERK and RBI Assistant Mains Exam – SET 2
Important MIXED DATA INTERPRETATION Questions for IBPS CLERK and RBI Assistant Mains Exam – SET 2
Study the following line graph and pie chart carefully and answer the questions.
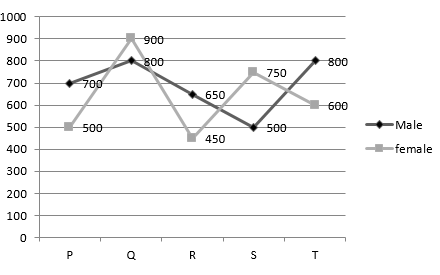
The following line graph shows the number of male and female employees in the five different Companies.
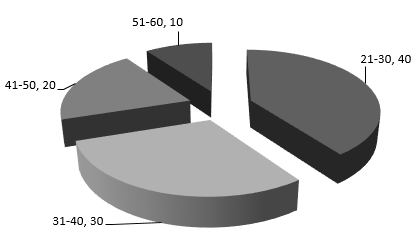
The following pie chart shows the percentage of employees in different age groups of each company.
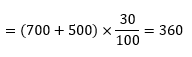
Q.1) How many employees of company P belongs to the age group of 31-40?
(a) 300
(b) 320
(c) 360
(d) 400
(e) None of these
Study the following line graph and pie chart carefully and answer the questions.
The following line graph shows the number of male and female employees in the five different Companies.
The following pie chart shows the percentage of employees in different age groups of each company.
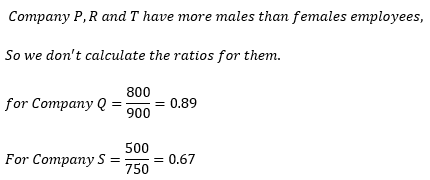
Q.2) Which one of the following disciplines has the lowest ratio of male to female employees?
(a) S
(b) R
(c) Q
(d) P
(e) None of these
Study the following line graph and pie chart carefully and answer the questions.
The following line graph shows the number of male and female employees in the five different Companies.
The following pie chart shows the percentage of employees in different age groups of each company.
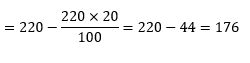
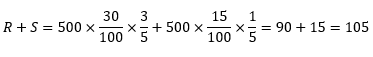
Q.3) If the number of male employees of Company R in the age group of 41-50 is equal to 20% of all the employees of Company R in the same age group, then what is the number of female employees of Company R in the age group of 41-50?
(a) 146
(b) 156
(c) 166
(d) 176
(e) None of these
Study the following line graph and pie chart carefully and answer the questions.
The following line graph shows the number of male and female employees in the five different Companies.
The following pie chart shows the percentage of employees in different age groups of each company.
Q.4) The number of female employees of company T is what percentage of the all the employees in company T?
(a) 41%
(b) 43%
(c) 45%
(d) 47%
(e) None of these
Study the following line graph and pie chart carefully and answer the questions.
The following line graph shows the number of male and female employees in the five different Companies.
The following pie chart shows the percentage of employees in different age groups of each company.
Q.5) What is the total number employees in all the companies together?
(a) 6450
(b) 6550
(c) 6650
(d) 6750
(e) None of these
Study the following given data carefully and answer the question.
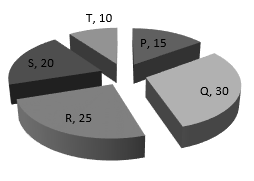
The following pie chart shows the percentage of students who passed in an exam from various department of a college. The total number of students who passed the exam =1500
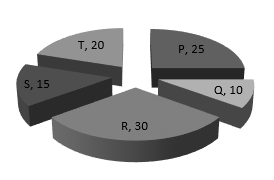
The following pie chart shows the percentage of students who failed in an exam from various department of a college. The total number of students who failed the exam =500
The following table shows the ratio between the male and female students who passed and failed in the exam,
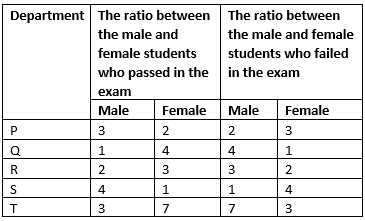
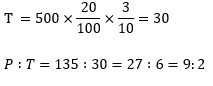
Q.6) What is the ratio of the number of male students who passed the exam from department P to the number of female students who failed the exam from department T?
(a) 5: 18
(b) 18: 5
(c) 9: 2
(d) 6: 17
(e) None of these
Study the following given data carefully and answer the question.
The following pie chart shows the percentage of students who passed in an exam from various department of a college. The total number of students who passed the exam =1500
The following pie chart shows the percentage of students who failed in an exam from various department of a college. The total number of students who failed the exam =500
The following table shows the ratio between the male and female students who passed and failed in the exam,
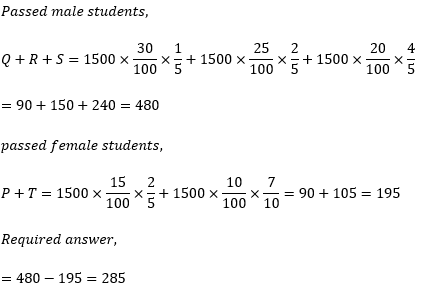
Q.7) What is the difference between the total number of male students who passed the exam from department Q, R and S together and the total number of female students who passed the exam from department P and T together?
(a) 270
(b) 275
(c) 280
(d) 285
(e) None of these
Study the following given data carefully and answer the question.
The following pie chart shows the percentage of students who passed in an exam from various department of a college. The total number of students who passed the exam =1500
The following pie chart shows the percentage of students who failed in an exam from various department of a college. The total number of students who failed the exam =500
The following table shows the ratio between the male and female students who passed and failed in the exam,
Q.8) The number of male students who failed the exam from department R and S together is approximately what percentage of the total number of female students who failed the exam from all departments?
(a) 45%
(b) 46%
(c) 47%
(d) 48%
(e) None of these
Study the following given data carefully and answer the question.
The following pie chart shows the percentage of students who passed in an exam from various department of a college. The total number of students who passed the exam =1500
The following pie chart shows the percentage of students who failed in an exam from various department of a college. The total number of students who failed the exam =500
The following table shows the ratio between the male and female students who passed and failed in the exam,
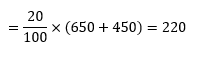
Q.9) What is the sum of average of total number of students who passed the exam from all departments together and the average of total number of students who failed the exam from all departments together?
(a) 200
(b) 400
(c) 600
(d) 800
(e) None of these
Study the following given data carefully and answer the question.
The following pie chart shows the percentage of students who passed in an exam from various department of a college. The total number of students who passed the exam =1500
The following pie chart shows the percentage of students who failed in an exam from various department of a college. The total number of students who failed the exam =500
The following table shows the ratio between the male and female students who passed and failed in the exam,
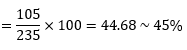
Q.10) The total number of students who failed the exam from all departments together is approximately what percentage of the total number of students who passed the exam from all departments together?
(a) 30%
(b) 31%
(c) 32%
(d) 35%
(e) None of these
Explanation
Q.1)
c
Q.2)
a
Q.3)
d
The number of employees of company R in the age group of 41 – 50
The number of male employees of company R in the age group of 41 – 50
Q.4)
b
![]()
Q.5)
c
= 700 + 800 + 650 + 500 + 800 + 500 + 900 + 450 + 750 + 600 = 6650
Q.6)
c
The number of male students who passed the exam from department
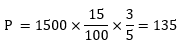
The number of female students who passed the exam from department
Q.7)
d
Q.8)
a
The failed male students
The total failed female students
P + Q + R + S + T
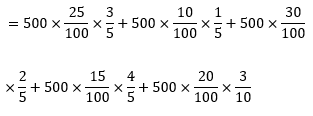
= 75 + 10 + 60 + 60 + 30 = 235
Required answer,
Q.9)
b
![]()
Q.10)
e
![]()