Target SBI PO Mains : Aptitude day 15 : Mixed Data Interpretation
Want to Become a Bank, Central / State Govt Officer in 2020?
Join the Most awarded Coaching Institute & Get your Dream Job


Now Prepare for Bank, SSC Exams from Home. Join Online Coure @ lowest fee
Lifetime validity Bank Exam Coaching | Bank PO / Clerk Coaching | Bank SO Exam Coaching | All-in-One SSC Exam Coaching | RRB Railway Exam Coaching | TNPSC Exam Coaching | KPSC Exam Coaching
Target SBI PO Mains : Aptitude day 15 :
Mixed Data Interpretation
D.1-5)


| Cities | 2005 | 2006 | ||
| Literate% | Illiterate% | Literate% | Illiterate% | |
| M | 45 | 55 | 55 | 45 |
| N | 50 | 50 | 72 | 28 |
| O | 35 | 65 | 50 | 50 |
| P | 55 | 45 | 60 | 40 |
| Q | 50 | 50 | 60 | 40 |
Q.1) What is the total illiterate population rise or fall in 2006 compare to 2005?
a) 2500 increase
b) 2400 decrease
c) 1800 increase
d) 2100 decrease
e) No changes
Q.2) What is the total literate population in 2006 in all the cities together (in thousands)?
a) 207.1
b) 217.2
c) 209.62
d) 307.65
e) 198.42
Q.3) What is the ratio between the literate population of city M in 2006 and the illiterate population of city P in 2005?
a) 10 : 11
b) 13 : 10
c) 9 : 7
d) 11 : 10
e) 6 : 7
Q.4) What is the average literate population in 2005?
a) 27760
b) 42730
c) 36480
d) 18860
e) 24000
Q.5) What is the percentage rise in literate population of city Q from the year 2005 to 2006?
a) 65%
b) 55%
c) 68%
d) 54%
e) 73%
D.6-10) Study the following information carefully and answer the questions given below:
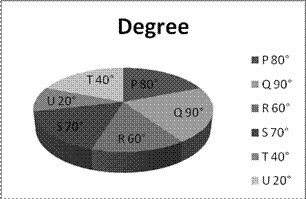
Six different companies P, Q, R, S, T and U make two items I and II. The total number of items produced by these six companies is 2,00,000. The cost of production of each item is Rs.20,000. The distribution of the total production by these companies is given in the following pie-chart and the table shows the ratio of production of Item I to that of Item II and the percentage profit earned by these companies on each of these items.

| Company | Ratio of Production | Percent Profit earned | ||
| Item I | Item II | Item I | Item II | |
| P | 4 | 1 | 30 | 24 |
| Q | 3 | 2 | 15 | 25 |
| R | 2 | 3 | 10 | 12 |
| S | 1 | 2 | 25 | 30 |
| T | 1 | 3 | 15 | 20 |
| U | 2 | 3 | 20 | 15 |
Q.6) What is the profit earned by Company R on Item II?
a) 5.8 crore
b) 7.8 crore
c) 6.8 crore
d) 4.8 crore
e) None of these
Q.7) What is the total cost of production of Item I by companies S and T together?
a) 17.04 crore
b) 27.04 crore
c) 37.04 crore
d) 47.04 crore
e) None of these
Q.8) What is the ratio of the cost of production of Item II by Company P to the cost of production of Item I by Company Q?
a) 8 : 27
b) 27 : 8
c) 15 : 3
d) 3 : 15
e) None of these
Q.9) What is the total of the profit earned by Company U on production of Item II and the profit of Company S on production of Item I?
a) 8.48 crore
b) 6.48 crore
c) 5.48 crore
d) 4.48 crore
e) None of these
Q.10) What is the total of the profit earned by Company ‘T’on production of Item I and the profit of Company P on production of Item II?
a) 4.94 crore
b) 5.94 crore
c) 6.94 crore
d) 7.5 crore
e) None of these


