Important Data Interpretation Set – 100
Want to Become a Bank, Central / State Govt Officer in 2020?
Join the Most awarded Coaching Institute & Get your Dream Job


Now Prepare for Bank, SSC Exams from Home. Join Online Coure @ lowest fee
Lifetime validity Bank Exam Coaching | Bank PO / Clerk Coaching | Bank SO Exam Coaching | All-in-One SSC Exam Coaching | RRB Railway Exam Coaching | TNPSC Exam Coaching | KPSC Exam Coaching
Important Data Interpretation Set – 100
D.1-5) In the following graph, students passing in five years 2008 to 2012 from two schools A and B are given. On the basic of this graph, answer the following questions.
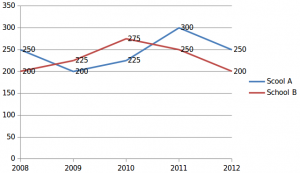
1).What is the total number of students passed from both schools during 2009 to 2011?
a) 1525
b) 1475
c) 1425
d) 1375
e) None of these
2). The ratio of students passed from school A to those from school B in the years 2010 and 2012 together is
a) 20:19
b) 19:20
c) 5:4
d) 4:5
e) None of these
3).The total number of students passing from school A from the year 2008 to 2010 is what percentage of the number of students passing from school B from the year 2010 to 2012?
a) 25%
b) 51.35%
c) 74%
d) 91%
e) None of these 
4).The average number of students passed from school A and School B?
a) 245 and 230
b) 251 and 231
c) 225 and 255
d) 245 and 212
e) None of these The average of students passed from school A The average of students passed from school B 

5) If the total number of students from school A is 500 each year, the total number of students passed from school A except 2010 is what percent of the total number of students from school A in whole years?
a) 55%
b) 60%
c) 75%
d) 40%
e) None of these The total number of students from school A in whole years = 2500 The total number of students passed from school A except 2010 = 1000
D.6-10) The Following data table shows sale of five different motor vehicles across the years. Study it and answer the questions based on it.
| Year
Vehicle |
2007 | 2008 | 2009 | 2010 | 2011 |
| Jeep | 36 | 44 | 49 | 82 | 87 |
| Car | 27 | 37 | 81 | 37 | 66 |
| Motorcycle | 81 | 29 | 75 | 80 | 69 |
| Three-wheeler | 123 | 82 | 107 | 87 | 84 |
| Truck | 32 | 49 | 45 | 13 | 37 |
6) In which of the following two years, the sale of all vehicles taken together is equal?
a) 2007, 2010
b) 2008, 2009
c) 2010, 2011
d) 2007, 2011
e) 2007, 2011
7) Find the maximum difference of all the vehicles sold over the years.
a) 81
b) 105
c) 116
d) 67
e) 82
8) Trucks sold in 2007 and 2008 taken together is what percent of the trucks sold in the remaining years? (approximately)
a) 80%
b) 83%
c) 85%
d) 84%
e) 89% 
9) If three-wheelers sold were rejected due to some fault in the engine in the year 2009, then, total numbers of remaining type of vehicle is approximately what percent of sale of all vehicles in that year?
a) 70%
b) 65%
c) 110%
d) 88%
e)None of these 
10) If the cost of two cars is equal to that of three jeeps. Then one has to purchase nearly how many Jeeps so that their cost is equal to the total cost of cars sold in the year 2010?
a) 55
b) 57
c) 58
d) 69
e) 70 37C=1.5×37=55