Data Interpretation For SBI PO : 65
Want to Become a Bank, Central / State Govt Officer in 2020?
Join the Most awarded Coaching Institute & Get your Dream Job


Now Prepare for Bank, SSC Exams from Home. Join Online Coure @ lowest fee
Lifetime validity Bank Exam Coaching | Bank PO / Clerk Coaching | Bank SO Exam Coaching | All-in-One SSC Exam Coaching | RRB Railway Exam Coaching | TNPSC Exam Coaching | KPSC Exam Coaching
Data Interpretation For SBI PO : 64
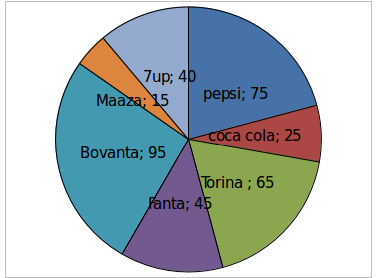
D 1-5) Go through the data set given below and solve the questions based on it.
The pie chart shows the productions of different products in degree.
The total number of production = 16200
1) The production of Bovanto is what percentage more than the production of Fanta?
a) 112%
b) 114%
c) 120%
d) 111%
e) None of these
2) The production of maaza in the year 2017 is 20% more than the production in the year 2016, the production of Pepsi in the year 2017 is 30% more than the production in the year 2016, then what is the approximate Difference between the production of Pepsi and Maaza in the year 2016?
a) 2040
b) 2030
c) 2130
d) 1940
e) None of these
3) what is the Ratio of the production of Torina and Pepsi in the year 2017?
a) 13:25
b) 17:15
c) 15:13
d) 13:15
e) None of these
4) what is the total production of maaza, coca cola, Torina, Pepsi, and Fanta?
a) 10135
b) 10115
c) 10125
d) 11125
e) None of these
5) What is the difference between the production of Pepsi and coca cola?
a) 2350
b) 2250
c) 2450
d) 2050
e) None of these
D.6-10) Go through the data set given below and solve the questions based on it.
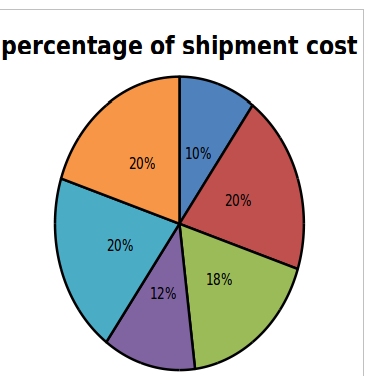
The pie chart 1 shows the percentage of eggs export to different countries from Andhra Pradesh. The pie chart 2 given the details about shipment cost of various countries per egg (in Rs)
Total number of eggs= 300000
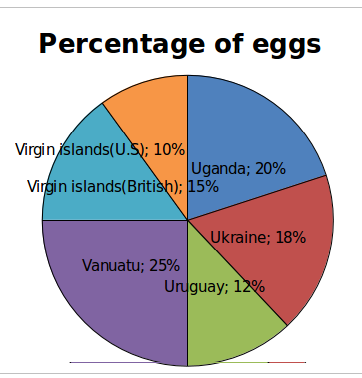
Total shipment cost of various countries =Rs.200
6) what is the total shipment cost of Ukraine and Vanuatu?
a) 369000
b) 471400
c) 3960000
d) 470400
e) None of these
7) If the total shipment cost of Kenya is 20% more than total shipment cost of virgin islands(US) and the number of eggs export to Kenya is 50 % of the number of eggs export to Uruguay, then what is the approximate shipment cost of Kenya per egg (in Rs)?
a) Rs.82
b) Rs.80
c) Rs.83
d) Rs.80.5
e) None of these
8) what is the total shipment cost of Virgin Islands (British)?
a) 2105000
b) 1200000
c) 1800000
d) 200400
e) None of these
9) what is the different between the total shipment cost of Uganda and the total shipment cost of Uruguay?
a) 69000
b) 85600
c) 96000
d) 86000
e) None of these
10) The total shipment cost of Vanuatu is what percentage more than the total shipment cost of Virgin Islands (U.S)?
a) 45%
b) 56%
c) 55%
d) 50%
e) None of these
![Union Budget 2020 - Important Takeaways & Key Highlights for Exams [Download PDF]](http://s3-eu-central-1.amazonaws.com/bankersdaily/wp-content/uploads/20200201213146/the-creative-room-1.jpg)