Data Interpretation : Set 01
Directions 1-5) Study the following pie graph carefully and answer the questions given below.
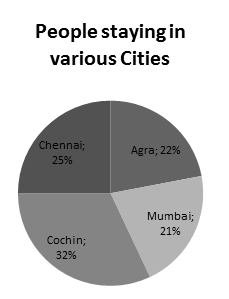
A Survey Conducted on 5800 People staying in Various Cities and Having Various Favourite Car Models
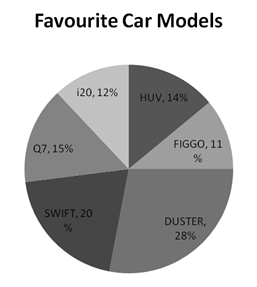
1) Duster is the favourite car of 50% of the people from city Cochin. People having their favourite car as duster from Cochin from approximately what per cent of the people having their favourite car as Duster from all the cities together?
a) 48
b) 53
c) 61
d) 57
e) 45
2) 20% of the people from Chennai have Swift as their favourite car and 12% of the people from the same city have HUV as their favourite Car. How many people from that city like other car?
a) 764
b) 896
c) 874
d) 968
e) None of these
3) How many people in all have Q7 as their favourite car?
a) 850
b) 864
c) 870
d) 812
e) None of these
4) What is the average number of people who like Custard Q7, Figgo and Duster?
a) 1085
b) 1044
c) 1090
d) 1100
e) 1200
5) What is the total no. of people staying in Chennai, Mumbai and Cochin?
a) 4360
b) 3900
c) 4820
d) 4524
e) None of these
D.66-70). Study the following graph carefully to answer these questions.
The Production of fertilizer in lakh tons by different companies for three year 2015, 2016 and 2017
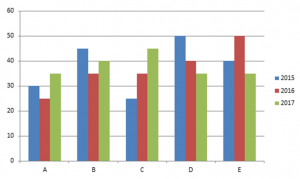
6) The total production by five companies in 2017 is what percent of the total production by companies B & D in 2015 ?
a) 100%
b) 150%
c) 95%
d) 200%
e) None of these
7) What is the ratio between average productions by company B in three years to the average production by company C in three years?
a) 6:7
b) 8:7
c) 7:8
d) 7:6
e) 9:8
8) For which of the following companies the rise or fall in production of fertiliser from 2015 to 2016 was minimum?
a) A
b) B
c) C
d) D
e) E
9) What is the per cent drop in production by company D from 2015 to 2017?
a) 30
b) 43
c) 50
d) 35
e) 28
10) The average production for three years was maximum for which of the following companies?
a) B only
b) D only
c) E only
d) B & D both
e) D & E both