Practice Questions – Data Interpretation -1

Practice Questions – Data Interpretation -1
Directions: Study the following carefully and answer the following Questions
The production of fertilizer in lakh tonnes by different companies for three years 1996,1997&1998
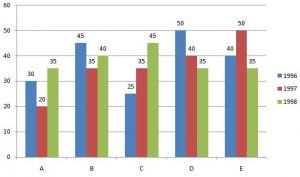
1. The total production by five companies in 1998 is what percentage of the total production by companies B & D in 1996?
(a) 100%
(b) 150%
(c) 95%
(d) 200%
(e) None of these
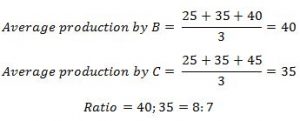
2. What is the ratio between average productions of Company B in three years to the average production by company C in three years?
(a) 6:7
(b) 8: 7
(c) 7:8
(d) 7:6
(e) None of these
3. For which year of the following companies the rise or fall in the production of fertilizer from 1996 to 1997 was the maximum?
(a) A
(b) B
(c) C
(d) D
(e) E
4. What is the percent drop in production by company D from 1996 to 1998?
(a) 30
(b) 43
(c) 50
(d) 35
(e) None of these
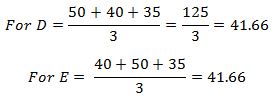
5. The average production for three years was maximum for which of the following companies?
(a) B only
(b) D only
(c) E only
(d) B & D both
(e) D & E both
Directions: Study the following Information carefully and answer the questions given below:
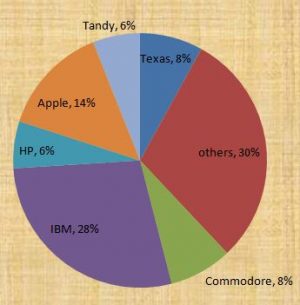
This Pie-Chart shows the distribution of New-York market share by value of different computer companies in 2005
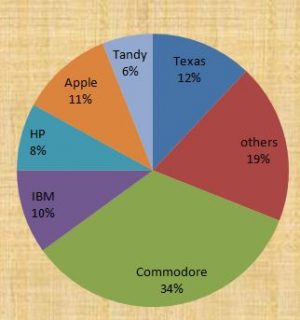
This Pie-Chart shows the distribution of New-York market share by volume of different computer companies in 2005
Number of units sold in New-York is 1500
Value of units sold is $ 1,650,000
6. For the year 2005, which company has realized the lowest average unit sales price for a PC?
(a) Commodore
(b) IBM
(c) Tandy
(d) Cannot be determined
(e) None of these
7. Over the period of 2005-2006, if sales (Value -wise) of IBM PC’s increased by 50% and of apple by 15% assuming that PC sales of all other computer companies remained the same, by what percentage (Approximately), would the PC sales in New-York (Value-wise) increase over the same period?
(a) 16.1%
(b) 18%
(c) 14.0%
(d) 19.0%
(e) None of these
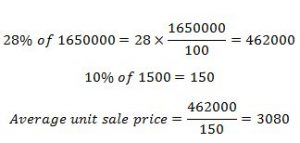
8. The average unit sale price of an IBM PC was approximately (in US$)
(a) 3180
(b) 3080
(c) 393
(d) 2800
(e) None of these
Directions: Study the following chart carefully and answer the questions.
Production of paper (In Lakh tonnes) by 3 different companies A,B and C over the years
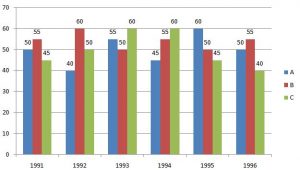
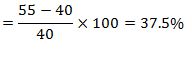
9. What is the percentage increase in production of company A from 1992 to 1993?
(a) 37.5
(b) 38.25
(c) 35
(d) 36
(e) None of these
10. The total production of Company C in 1993 and 1994 is what percentage of the total production of Company A in 1991 and 1992?
(a) 95
(b) 90
(c) 110
(d) 115
(e) None of these
Answer Key
1. (d) 2. (b) 3. (c) 4. (a) 5. (e) 6. (d) 7. (a) 8. (b) 9. (a) 10. (e)
Explanations
1. (D)
![]()
2. (B)
3. (C)
Maximum difference is 5 Lakh tonnes for three companies C,D and E. So our answer should be the company for which the production is least in 1996. Because to calculate the % increase or decrease our denominator is the production in 1996.
![]()
4. (A)
![]()
5. (E)
You should not calculate all the values to get the answer. You can decide by mere visual observation. For D & E both the average production is maximum.
6. (D) We don’t know, how many companies belongs to the category called “others” and its volume of sales. So we can’t determine which company has the lowest unit sale price.
7. (A) If we assume the total sales be 100 in the first year, IBM’s sales would go up by 50%(From 28 to 42) contributing an increase of 14 to the total sales value.
Similarly, apple’s increase of 15% would contribute an increase of 2.1 to the sales value. The net change would be 14+2.1= 16.1 on 100.
8. (B) IBM accounts for 28% of the share by value and 10% of the share by volume.
9. (A) Percentage increase of A from 1992 to 1993
10. (E)
![]()