Data Interpretation For SBI PO : Set – 12

Data Interpretation For SBI PO : Set – 12
(1-5) Study the following graph carefully and answer the questions given below:
Percentage of different types of employees in a company in two consecutive years


1) In 1997 the total no. of which of the following type of pair of employees was approximately equal to employees of type A in 1998?
a) B and C
b) A and C
c) D and E
d) C and D
e) C and F
2) From 1997 to 1998 in the case of which of the following type of employees the change was maximum?
a) B
b) D
c) C
d) A
e) None of these
3) What was the approximate difference in the number of employees of B type during 1997 and 1998?
a) 2285
b) 2325
c) 2085
d) 2620
e) 1825
(a) Year A B C D E F 1997 8596 2579 4298 6447 11605 9455 1998 10701 4864 5350 4378 13133 10214 B type employee;

4) If the number of employees of type D in 1998 was 5000, what would have been its approximate percentage in the company?
a) 8%
b) 12%
c) 14%
d) 16%
e) 10%
5) The number of employees of A type in 1998 was approximately what percent of the no. of A type of employees in 1997?
a) 115%
b) 140%
c) 125%
d) 130%
e) 95%
(c) Year A B C D E F 1997 8596 2579 4298 6447 11605 9455 1998 10701 4864 5350 4378 13133 10214

(6-10) Study the table carefully to answer the question that follow.
Number of employees working in four different companies in five different years.
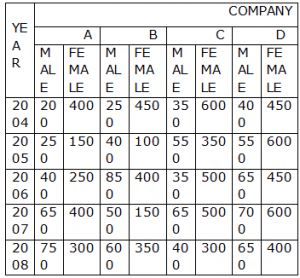
6) What was the total number of male working in company-A in the year 2007, male working in company-B in the year 2005 and females working in Company-D in the year 2006 together?
a) 1550
b) 1600
c) 1450
d) 1400
e) None of these
(e)
7) What was the average number of female employees working in all the companies together in the year 2004 ?
a) 475
b) 385
c) 450
d) 300
e) None of these
(a) 

8) Total number of male employees working in Company-C over all the years together was approximately what percentage of total number of employees working in the years 2007 in all the companies together?
a) 41
b) 46
c) 51
d) 55
e) 59
(d) Company C male employees = 2300 2007 all employees = 4150

9) If 20% of male and 30% of female employees in Company-B in the year 2004 were handicapped, then what was the total number of handicapped candidates in that year?
a) 185
b) 170
c) 190
d) 195
e) None of these
(a)


10)What was the respective ratio between the number of males in company-D in the year 2005, number of females in company-A in the year 2006 and the number of males in company-B in the year 2005?
a) 11:5:8
b) 11:6:8
c) 12:5:9
d) 12:5:7
e) 11:5:9
(a)