Data Interpretation For SBI PO : Set – 32

D.1-5) The following table shows the number of new employees added to different categories of employees in a company and also the number of employees from these categories who left the company every year since the foundation of the Company in 1995.

1) What was the total number of Peons working in the Company in the year 1999?

a) 1312

b) 1192

c) 1088

d) 968

e) 908

Click Here to View Answer

b)

Total number of Peons working in the Company in 1999 = (820 + 184 + 152 + 196 + 224) – (96 + 88 + 80 + 120)= 1192

2) What is the pooled average of the total number of employees of all categories in the year 1997?

a) 1325

b) 1285

c) 1265

d) 1235

e) 1195

Click Here to View Answer

e)

Total number of employees of various categories working in the Company in 1997 are:

Managers = (760 + 280 + 179) – (120 + 92) = 1007.

Technicians = (1200 + 272 + 240) – (120 + 128) = 1464.

Operators = (880 + 256 + 240) – (104 + 120) = 1152.

Accountants = (1160 + 200 + 224) – (100 + 104) = 1380.

Peons = (820 + 184 + 152) – (96 + 88) = 972.

Therefore Pooled average of all the five categories of employees working in the Company in 1997

= 1/5x (1007 + 1464 + 1152 + 1380 + 972)

= 1 /5x (5975)

= 1195

3) During the period between 1995 and 2000, the total number of operators who left the Company is what percent of the total number of operators who joined the Company?

a) 19%

b) 21%

c) 27%

d) 29%

e) 32%

Click Here to View Answer

d)

Total number of Operators who left the Company during 1995 – 2000

= (104 + 120 + 100 + 112 + 144)

= 580.

Total number of Operators who joined the Company during 1995 – 2000

= (880 + 256 + 240 + 208 + 192 + 248)

= 2024.

Therefore Required Percentage = ( 580 x 100 ) % = 28.66% ~= 29%.

4) For which of the following categories the percentage increase in the number of employees working in the company from 1995 to 2000 was the maximum?

a) Managers

b) Technicians

c) Operators

d) Accountants

e) None of these

Click Here to View Answer

a)

Number of managers working in Company

In 1995 = 760.

In 2000 = (760 + 280 + 179 + 148 + 160 + 193) – (120 + 92 + 88 + 72 + 96)=1252

Therefore Percentage increase in the number of Managers

= (1252 – 760) /760x 100 % = 64.74%. 

Number of Technicians working in the Company:

In 1995 = 1200.

In 2000 = (1200 + 272 + 240 + 236 + 256 + 288) – (120 + 128 + 96 + 100 + 112)=1936

Therefore Percentage increase in the number of Technicians

= (1936 – 1200) /1200 x 100 % = 61.33%.

Number of Operators working in the Company:

In 1995 = 880.

In 2000 = (880 + 256 + 240 + 208 + 192 + 248) -(104 + 120 + 100 + 112 + 144)=1444

Therefore Percentage increase in the number of Operators

= (1444 – 880)/880 x 100 % = 64.09%.

Number of Accountants working in the Company:

In 1995 = 1160.

In 2000 = (1160 + 200 + 224 + 248 + 272 + 260) -(100 + 104 + 96 + 88 + 92)=1884

Therefore Percentage increase in the number of Accountants

= (1884 – 1160)/1160 x 100 % = 62.41%.

Clearly, the percentage increase is maximum in case of Managers.

5) What is the difference between the total number of technicians added to the company and the total number of Accountants added to the company during the years 1996 to 2000?

a) 128

b) 112

c) 96

d) 88

e) 72

Click Here to View Answer

d)

Required difference = (272 + 240 + 236 + 256 + 288) – (200 + 224 + 248 + 272 + 260)= 88.

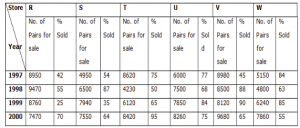
D.6-10) Study the table carefully to answer the following questions:

Number of Shoe pairs for sale and percentage of Shoe pairs actually sold In 6 different shoe stores over the years.


6) What is the approximate average number of shoe pairs sold by Store S over the year?

a) 5145

b) 4324

c) 3985

d) 4260

e) 2498

Click Here to View Answer

c)

Number of Shoe pairs sold by Store S

1997 = 54 *4950/100= 2673

1998 =  87* 6500/100=5655

1999 = 35 * 7940/100= 2779

2000 = 64*7550/100=4832

required Average = 2673+5655+2799+4832= 15939/4 =3985

7) What is the total number of shoe pairs that Store W did not manage to sell in the years 1997 and 1998 together?

a) 1860

b) 2542

c) 2190

d) 3759

e) None of these

Click Here to View Answer

e)

Required Number of pairs = (16*5150/100)+(37*4800/100) = 2600

8) The total number of shoe pairs actually sold by Store R over the years is approximately what per cent of the total number of-shoe pairs for sale in those years?

a) 42

b) 35

c) 38

d) 47

e) 52

Click Here to View Answer

d)

Total Number of Shoe pair sale in Store R in all years = 8950+9470+8760+7470 = 34920

1997 = 42 *8950/100= 3759

1998 =  55* 97400/100=5357

1999 = 25 * 8760/100= 2190

2000 = 70*7470/100= 5229

sold pairs 3759+5357+2190+5229 =16535

percentage  = 16535/34920*100=47%

9) What is the number of shoe pairs sold by Store T in 1999?

a) 4248

b) 3526

c) 3215

d) 4501

e) None of these

Click Here to View Answer

e)

Number of show pairs sold by Store T in 1999 = 65/100*6120 = 3978

10) What is the ratio of number of shoe pairs sold by Store U in 2000 to the number of shoe pairs sold by Store W in the same year?

a) 111 : 131

b) 2065 : 1441

c) 1447 : 2152Â

d) 1013 : 2613

e) None of these

Click Here to View Answer

b)

Number of shoe sold by store U in 2000 = 75/100*8260 =6195

Number of Shoe sold by store w in 2000 = 55/100*7860 = 4323

6195:4323

2065:1441